Spatial
Analysis
The
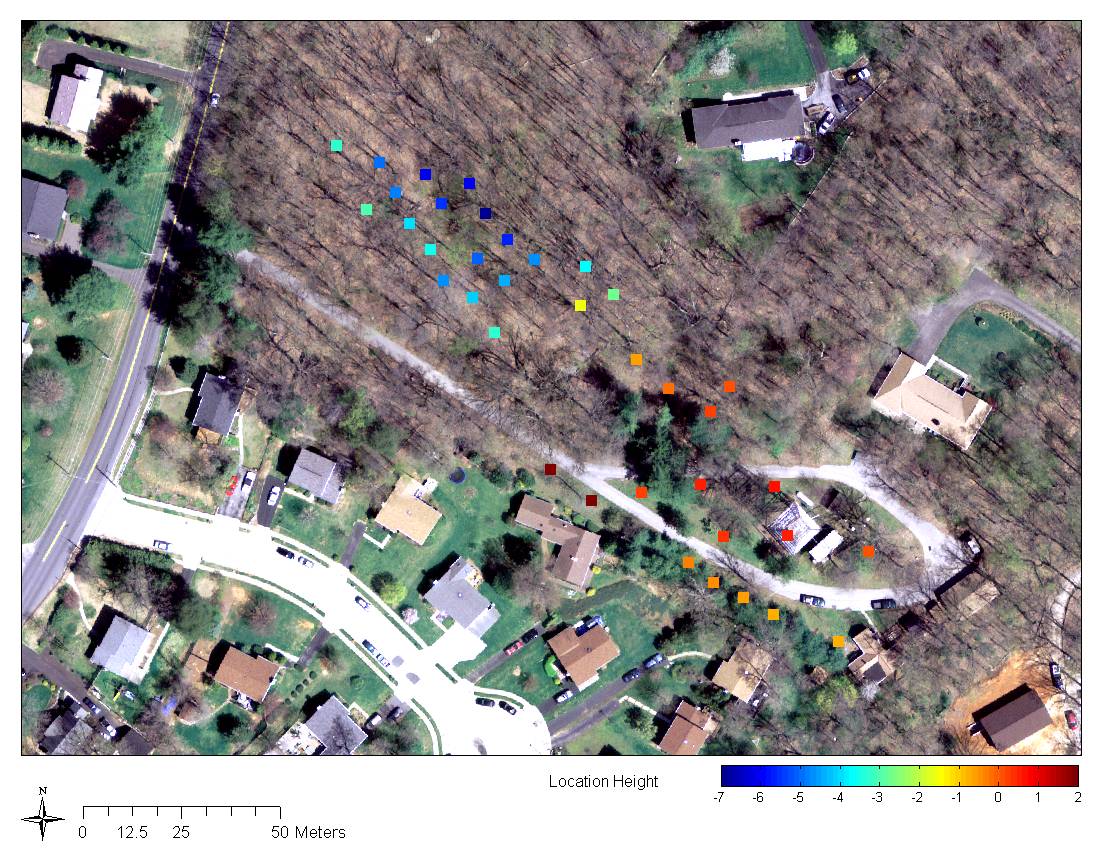
figure below shows the locations of the sensors in the Cub Hill deployment.
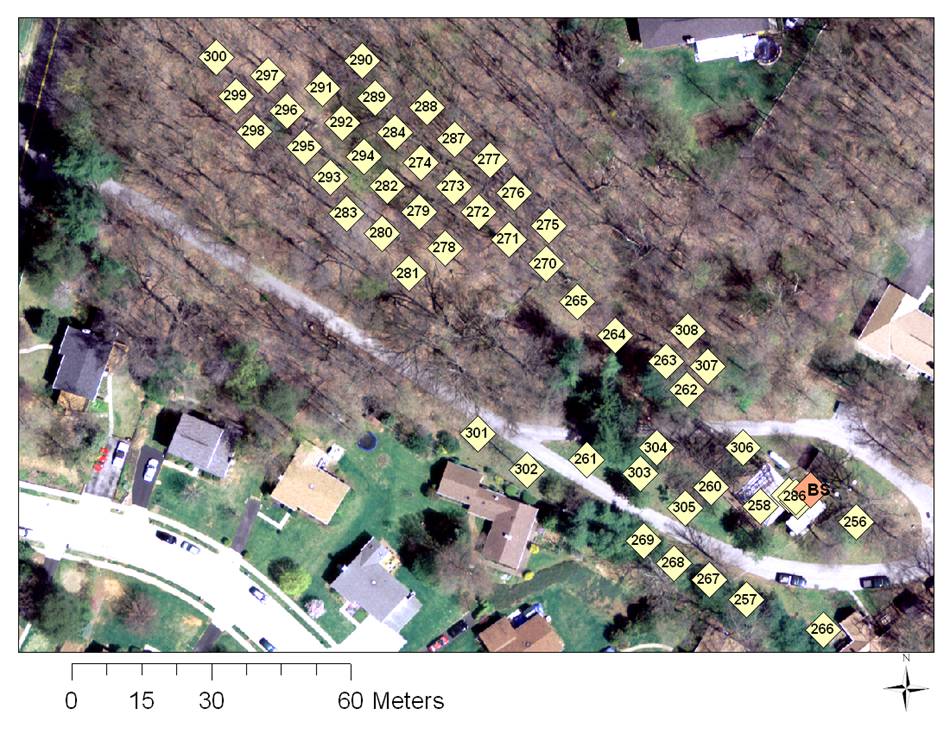
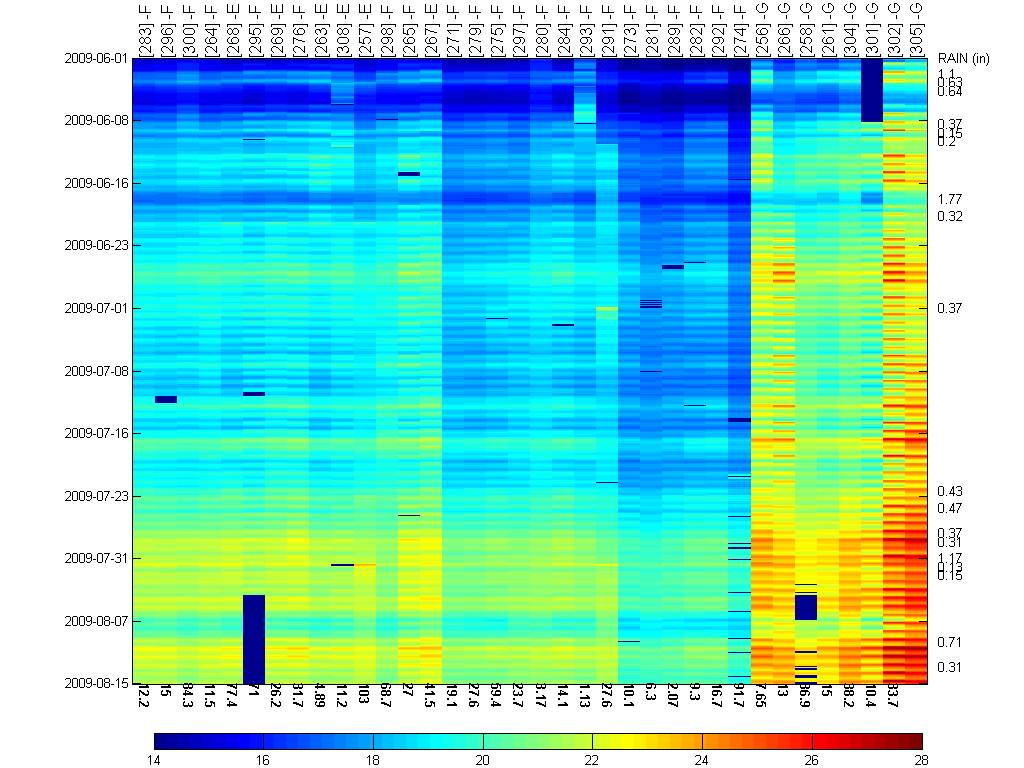
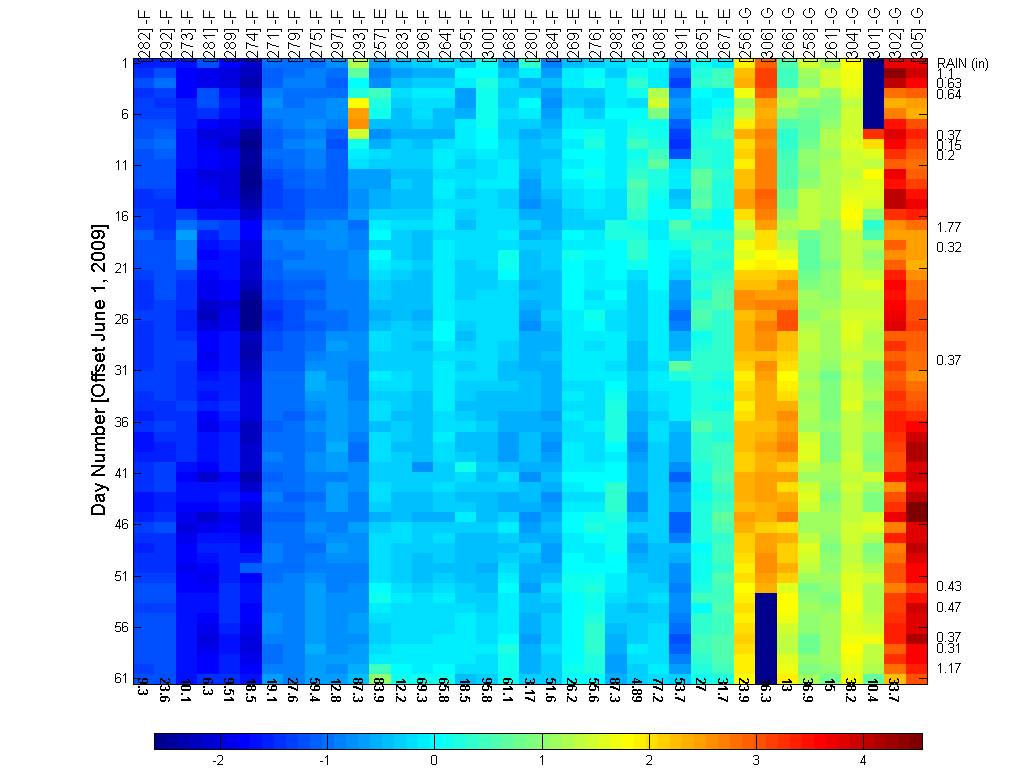
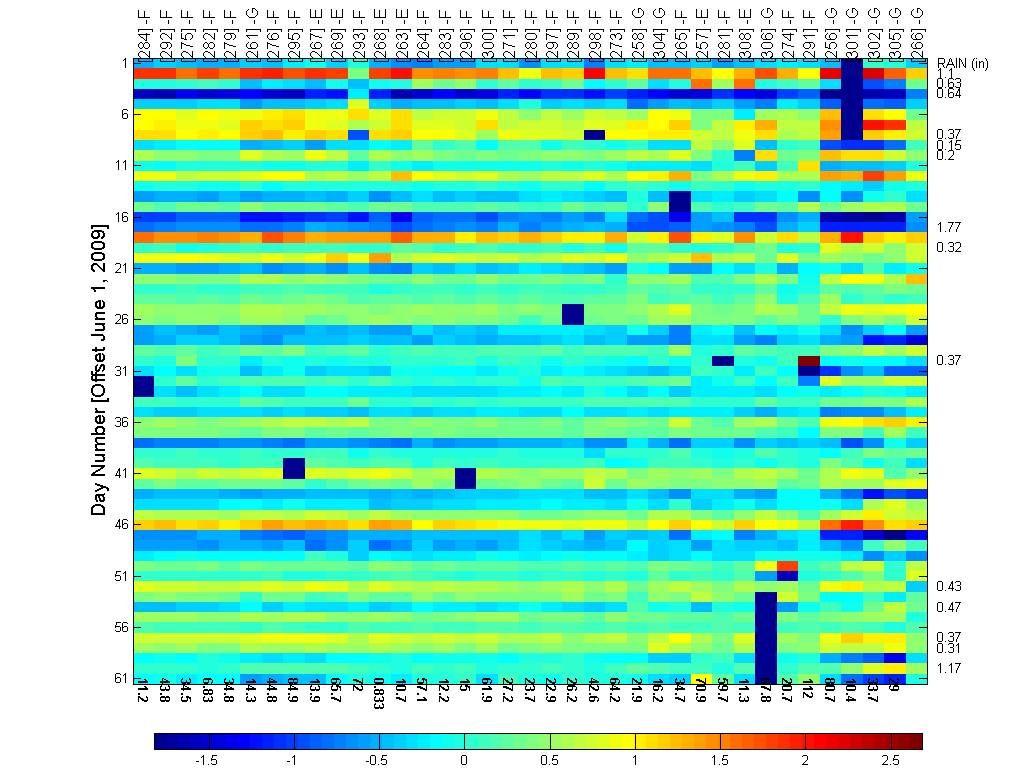
We begin by looking at two months of soil temperature
data (Jun 2009- Aug 2009) for the summer at depth 1. The heat map below shows
the soil temperature values for different locations in the Cub Hill deployment.
Note that not all locations are shown because some had a lot of missing values
and faults. A total of 37 locations were used in this analysis. The tags on top
indicate the type of location (F=forest, G=grass, E=edge of forest). The
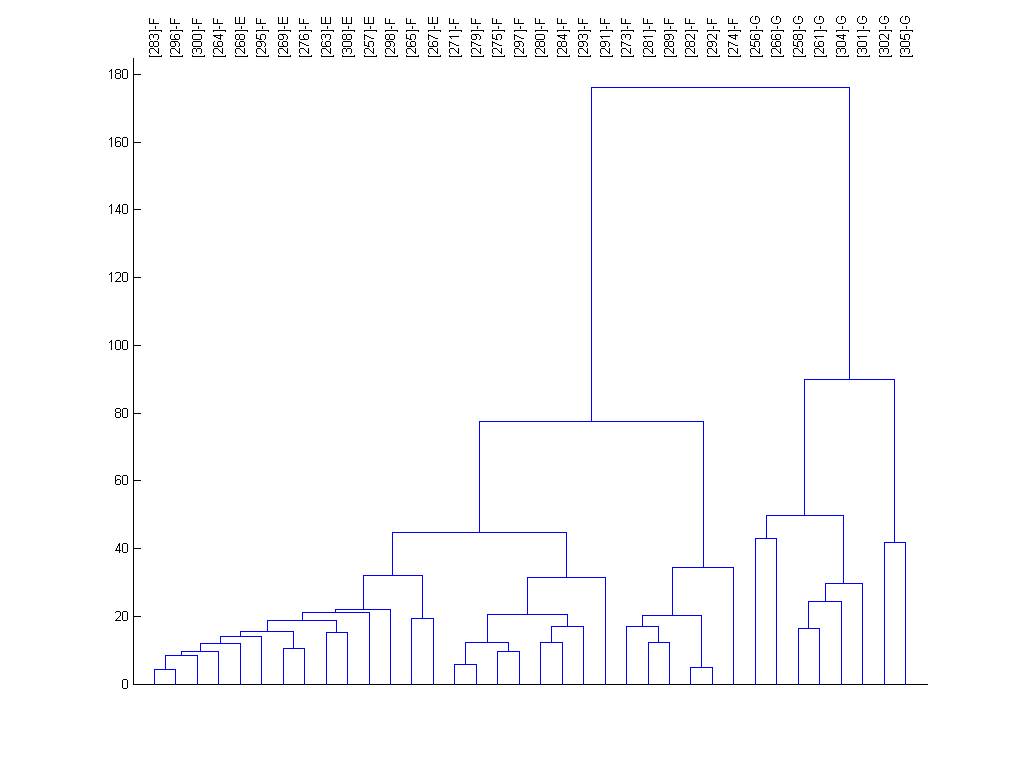
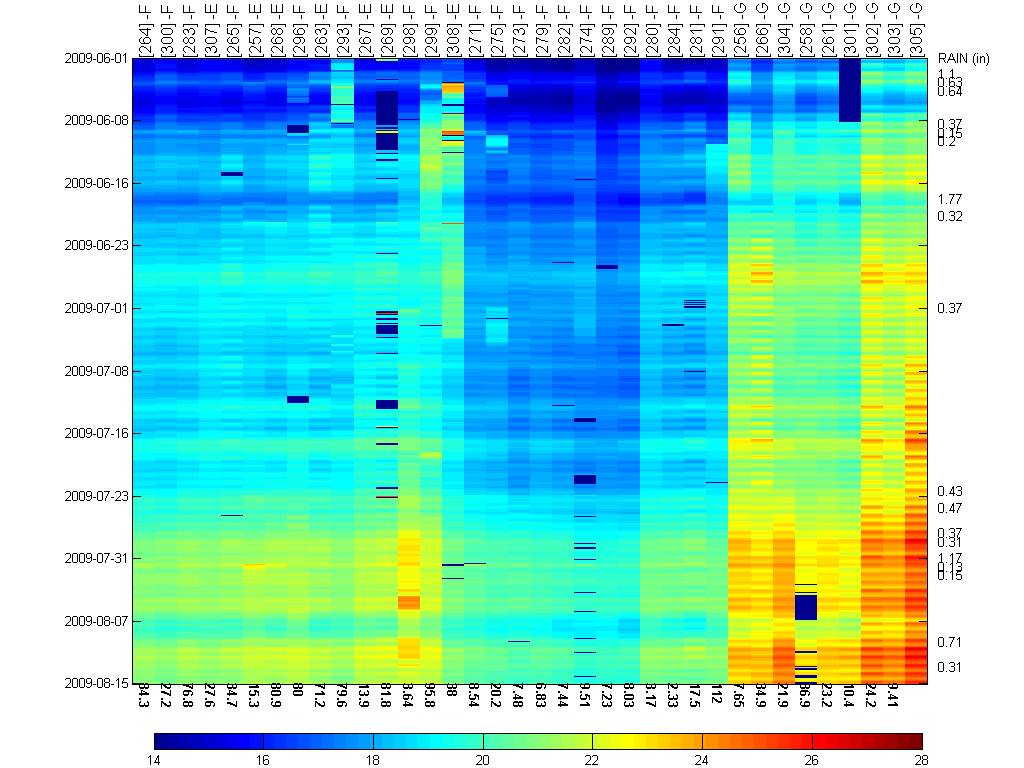
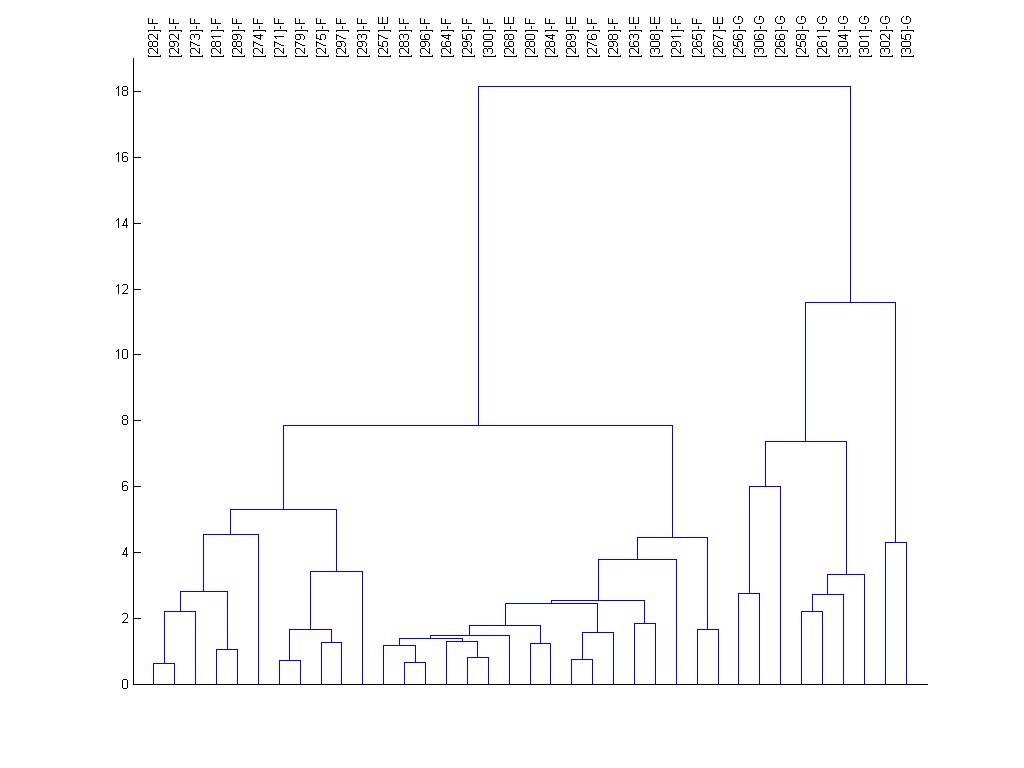
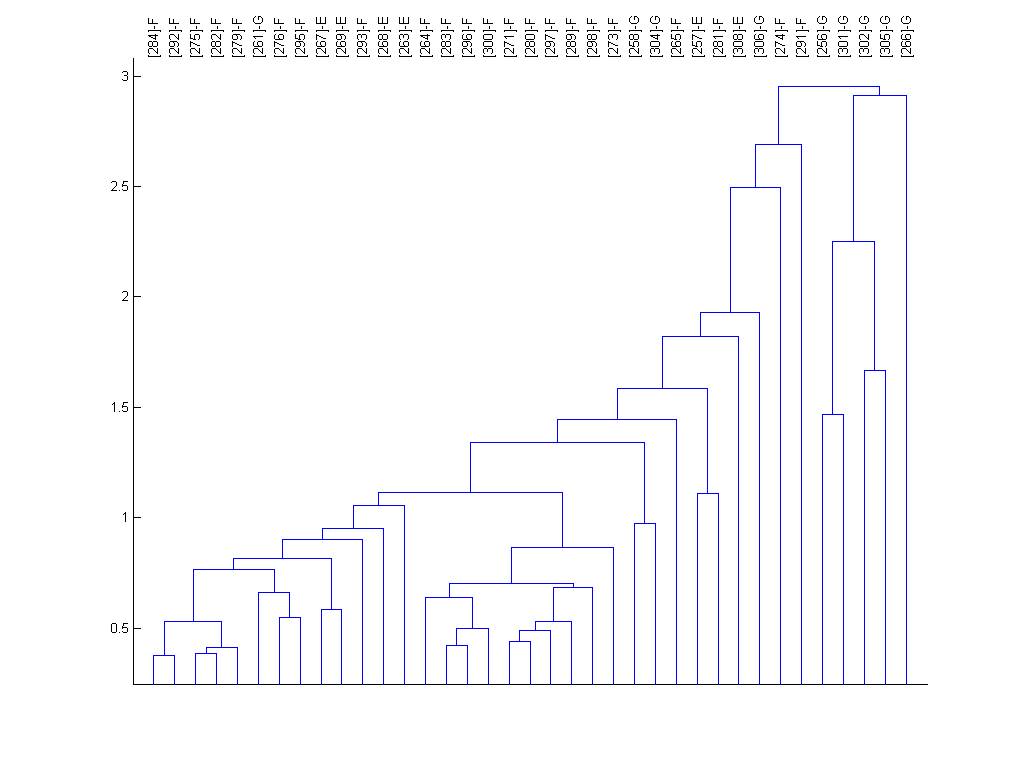
vectors are organized using the dendrogram clustering function in Matlab using
Euclidean distance and average linkage. The numbers at the bottom indicate the
distance between a location and its neighbor (to the right) in the color plot.
The dendrogram for the entire site list is shown below too.
The relative heights in meters for the corresponding
locations are shown below to see if there is any correlation between cluster
locations and heights.
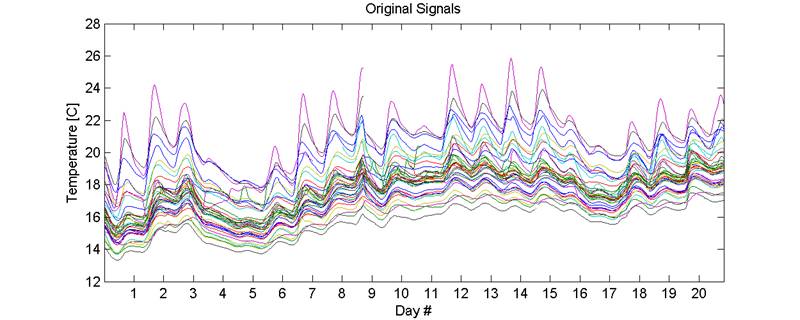
Next, we look at the raw time signals for the first 20
days between June 1, 2009 to Aug 1, 2009. Out of 50 locations, around 10
locations have a lot of missing values and noise so they and were removed from
this analysis
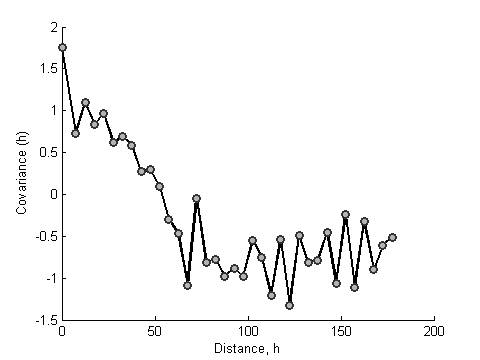
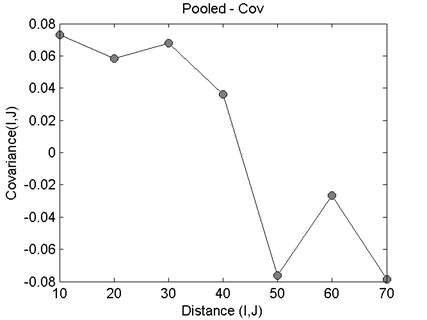
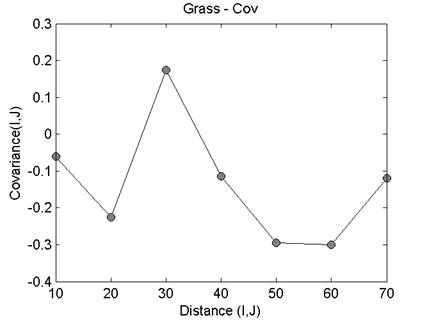
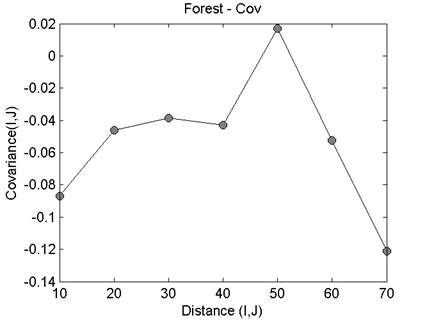
Correlation
Functions for daily means
The heatmap and dendrogram for the mean values is shown
below. Note that this plot shows the location mean minus the ensemble mean.
|
All Data |
Between Forest and Grass |
Within Forest and Grass |
|
|
|
|
|
|
|
|
|
|
|
|
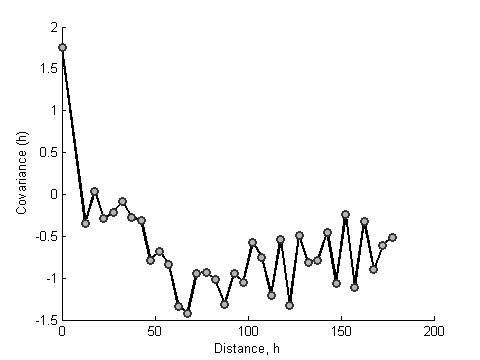
Correlation
function for the ramp value
Heat map and dendrogram for the daily ramp value
|
|
|
|
NOTES
- The
kriging library used is downloaded from http://mgstat.sourceforge.net/.
Simple kriging was tried. For each timestep, for 37 locations and 1504 points.
Identify the source of why it is so slow.
- Try
the clustering over winter months and the next summer?
- Leave
one-out cross validation
- Evaluate
locations where the relative error is the most.
- Per
cluster interpolation
- Take
more out and see how the error goes to see how many you can do without.
- Hour
of the day what happens.
- Apply
across moisture and see if we can define some sort of coverage concepts to
minimize the number of nodes