Eigenvectors
corresponding to the second moment matrix for the different depths and
different seasons for Soil temperature at Cub hill is shown in the figure
above. The corresponding energies are Shown in the figure below:
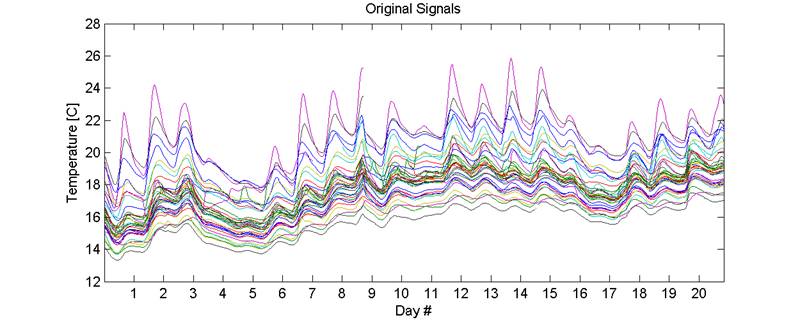
We begin by looking at one month in the summer at depth
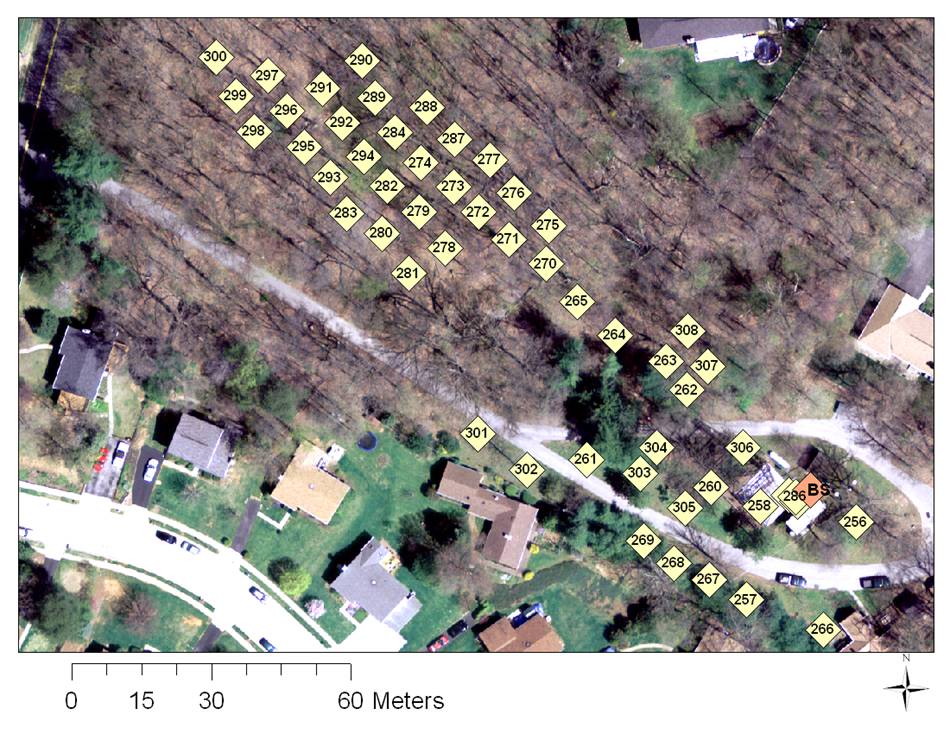
1. The figure below shows the raw time signals for July 1, 2009 to July 31,
2009. Out of 50 locations, around 4 loations have a lot of missing values and
were removed from this analysis. The raw time signals for 5 representative
signals are shown in the figure below. A number of signals are noisy and have a
lot of gaps.
After removing the daily ramp signal, the signals look as
follows:
The first 2 principal components are removed. The
residual for the representative signals look like the figure shown below.
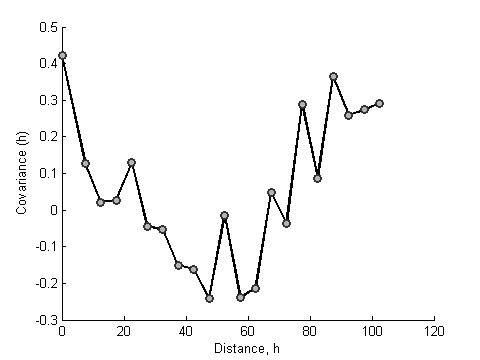
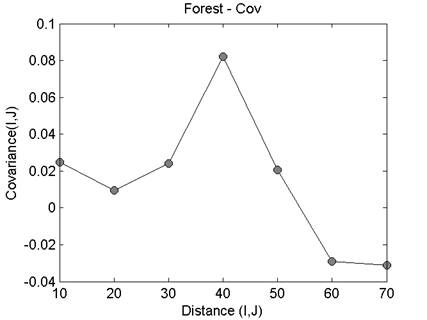
The median value of the variogram at a
given distance is shown in the figure below. The figure also shows the number
of samples using which the median was calculated.