GALEX false color images
On GALEX false color images
Sébastien Heinis, Alex Szalay, Mark Seibert, Tamás Budavári
Aims
Method
Some examples
Aims
Page top
The starting point of this work is to provide for GALEX an image
cutout service similar to the one already existing for SDSS. The
requirements for the images are to present an homogeneous background,
distinguish bright to faint objects, and we also wanted to display
false colors representative of the range of FUV-NUV colors present in
the data. We tried to build color images fulfilling these conditions.
Method
Page top
 We began working directly with the RGB color scheme. A basic
color mapping consists to set the R channel as NUV, the B channel as
FUV, and the G channel as a combination of FUV and NUV. It has been
however quite difficult to get a wide range of colors in this scheme;
this partly because we tried to map two independent informations on
three channels. We tried to use for the G channel a non linear
function of the FUV over NUV ratio, with no significant results. We
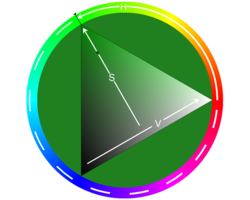
then decided to use, instead of RGB, the HSV color space (Hue Saturation
Value).
In this color space, Hue codes the dominant color, and is described by
a number between 0 (meaning red) and 360 (purple). The Saturation (0
< s < 1) sets the vibrancy of a given color, s = 0 coding the
dullest. Finally the Value v (0 < v < 1) sets the brightness.
We began working directly with the RGB color scheme. A basic
color mapping consists to set the R channel as NUV, the B channel as
FUV, and the G channel as a combination of FUV and NUV. It has been
however quite difficult to get a wide range of colors in this scheme;
this partly because we tried to map two independent informations on
three channels. We tried to use for the G channel a non linear
function of the FUV over NUV ratio, with no significant results. We
then decided to use, instead of RGB, the HSV color space (Hue Saturation
Value).
In this color space, Hue codes the dominant color, and is described by
a number between 0 (meaning red) and 360 (purple). The Saturation (0
< s < 1) sets the vibrancy of a given color, s = 0 coding the
dullest. Finally the Value v (0 < v < 1) sets the brightness.
More specifically, we first determine the mean and standard deviation
of the fluxes in the FUV and the NUV images. To do so, we slightly
smooth the images, using a gaussian filter of 1.5 pixel fwhm. This is
required as the actual fluxes have fairly discrete distributions, due
to the nature of the detector. We then compute normalized FUV and NUV
images as:
where FUV and NUV are the actual values in counts
sec-1pixel-1. This operation make both channels
to contribute at similar level; moreover this enables to set the sky
level, by tuning the clipping.
To get the colors, we use the cumulative distribution of the F/N
ratio, normalized to a suitable number to get the widest range of
colors. We fit this function by an atan, and set the Hue as the result
of such a fit for a given value of the FUV/NUV ratio. We set the
saturation value at a constant value of 0.95.
The normalized F and N values are used to build a chi2
image defined as follows:
We then use the asinh stretch
(Lupton et al. 2004) which allows to show faint objects as well
as details within bright ones, given the linear behavior of this
function at low values, and logarithmic at high values. We apply this
stretch to the chi 2 image, and use the result as the v
value.
Some examples
Page top
Below are presented examples of the color images created using the
technique discussed above. The mean and standard deviation of the UV
fluxes have been determined from 100 random chosen fields within each
survey.
We show 4 full resolution images of the same AIS or MIS field
obtained, left to right: by the standard pipeline method; by the
method presented here with 3 different color schemes: red-blue,
orange-blue and yellow-blue. For each of these three color schemes, we
show the color palette corresponding to the FUV/NUV ratio (increasing
from left to right).
Click on an image to open a window in order to see it at full
resolution. You may have to allow your browser to enable JavaScript
(e.g. for
IE)
)
)
)
)
)
)
)
)